Who leads the debate on waste, and what is it about?
Waste is debated in the Danish Parliament, in city councils, in trade and local media and on social media. We have gathered 33,259 public documents from the debate into one map. It shows which topics take up space and who takes part in them.
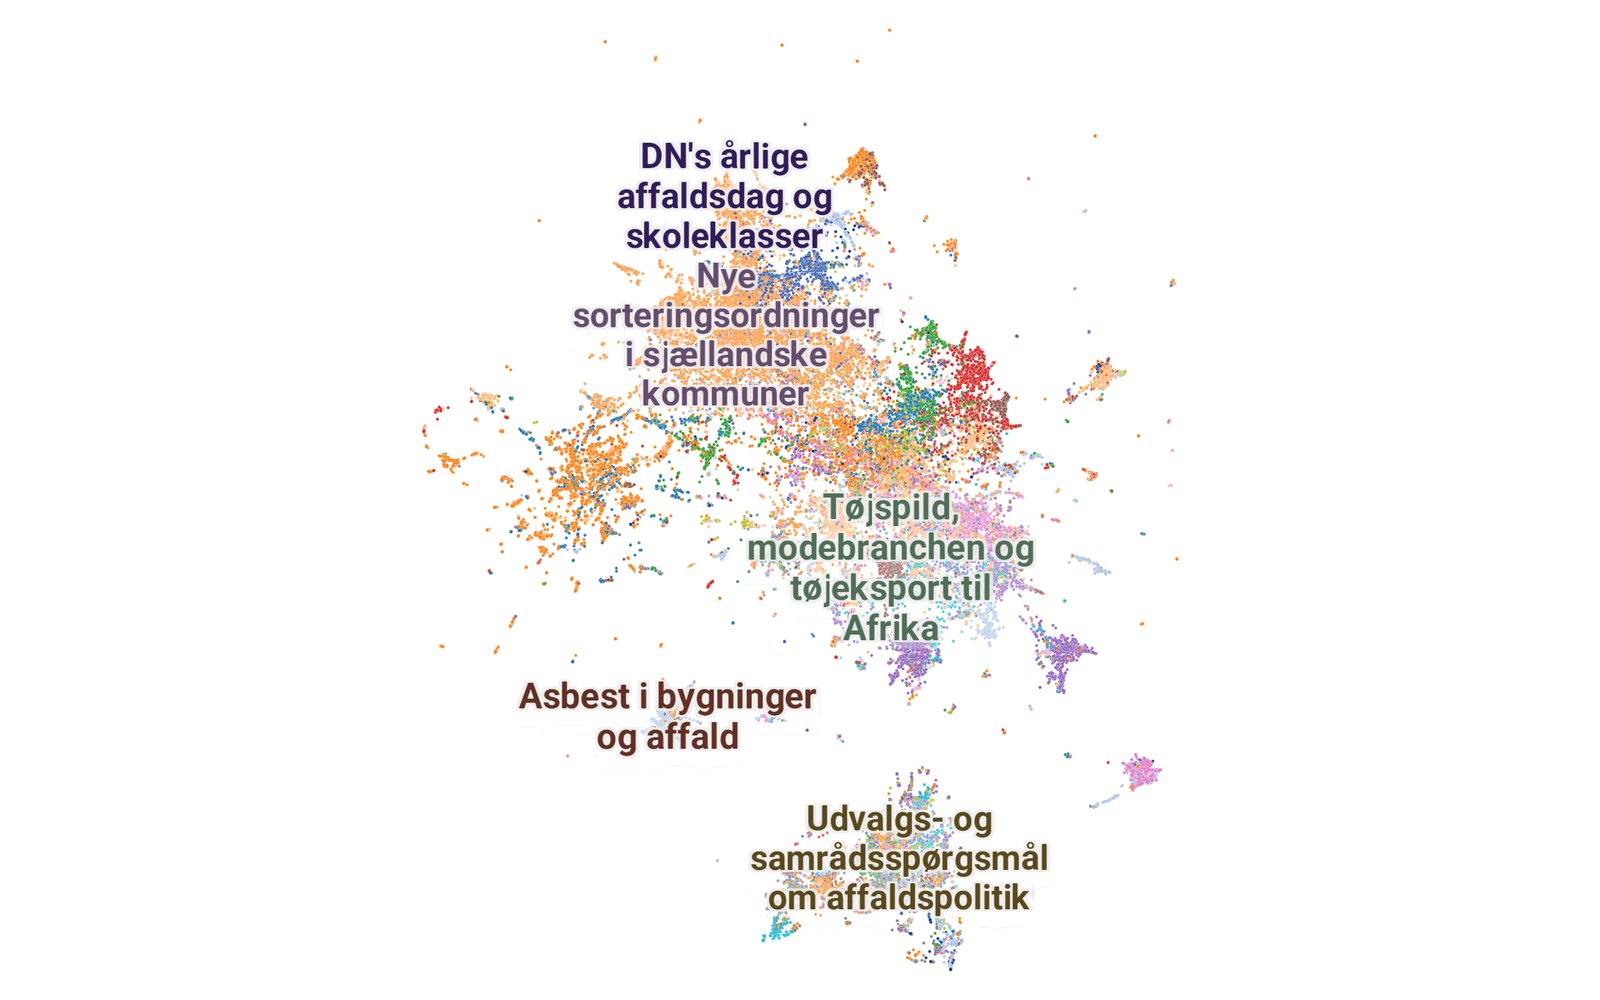
One point per document
The map holds 33,259 documents: news articles, opinion pieces, press releases, consultation responses, parliamentary questions, city council agenda items and social media posts. Each document is placed according to what it is about, so an article on waste fees ends up next to a council item on the same subject.
The documents fall into 237 named clusters. Points can be coloured by topic, document type or sender, and a time filter at the bottom of the map shows what was written in a given period.
Where the documents come from
The Danish Parliament's open data provides every question, answer and case about waste, with the name and party of the member asking. Municipal agendas provide the local decisions on fees, collection schemes and recycling sites. The rest comes from the archives of media and organisations, press releases, reports and public social media posts.
Altogether the documents come from more than 1,000 sources. The oldest date from 1996, but most are from recent years, when sorting and producer responsibility have dominated.
The actors behind the debate
A register of 1,632 actors links the documents to those who speak or are mentioned: politicians, municipalities and waste companies, private businesses, interest groups, researchers and media.
The actor map places the actors according to what they talk about. The network shows who appears in the same documents, revealing both the camps in the debate and the actors who connect them.
How the map is made
The title and summary of each document are turned into a numeric vector by a language model that understands Danish. UMAP lays the vectors out in two dimensions, and HDBSCAN finds the clusters, which we have then named. The tone of each document is scored with the Alexandra Institute's Danish sentiment model.
The method follows DTU ECHO Lab's map of the 2026 Danish general election, and the map is built with DataMapPlot, as ECHO Lab's is.
The map keeps growing
New documents are collected and added to the existing map, so the points stay where they are and new topics get their own clusters. The map was last updated on 24 September 2026.
If something is missing, or an actor is described incorrectly, please let us know at shn@datara.dk.