Where could low-temperature district heating work?
The purpose of the project is to identify the buildings and areas in Lyngby-Taarbæk with high potential for low-temperature district heating, as well as the businesses that can supply surplus heat to the district-heating network. The mapping shows both building suitability and possible local heat sources.
Why lower the temperature?
55/25 °C produces nearly 40 per cent less heat loss from the pipes than 80/40 °C. The lower temperature can also reduce the need for pipe insulation and make surplus heat from businesses easier to use. Some homes are not energy-efficient enough and may need improvements first so residents can stay warm in winter.
Building data in one place
The analysis combines data from the Danish building register, energy labels, expected annual consumption from Gasportalen and information about the existing district-heating network in Lyngby-Taarbæk Municipality. Missing values are estimated with statistical models developed for the analysis. The combined data is used to assess each building’s suitability for low-temperature district heating.
Building potential
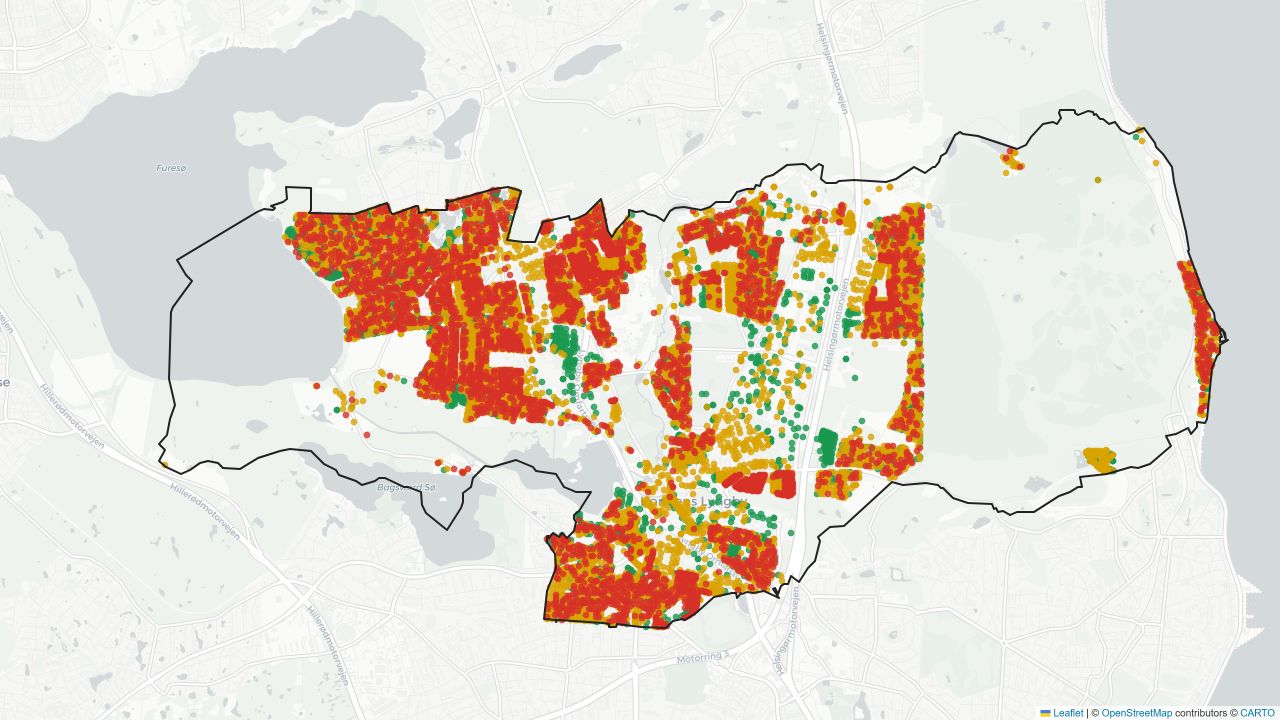
1,922 buildings have high potential. A further 6,554 may become suitable after improvements, while 4,051 have low potential.
The results are shown on a map alongside the existing district-heating network.
From buildings to streets
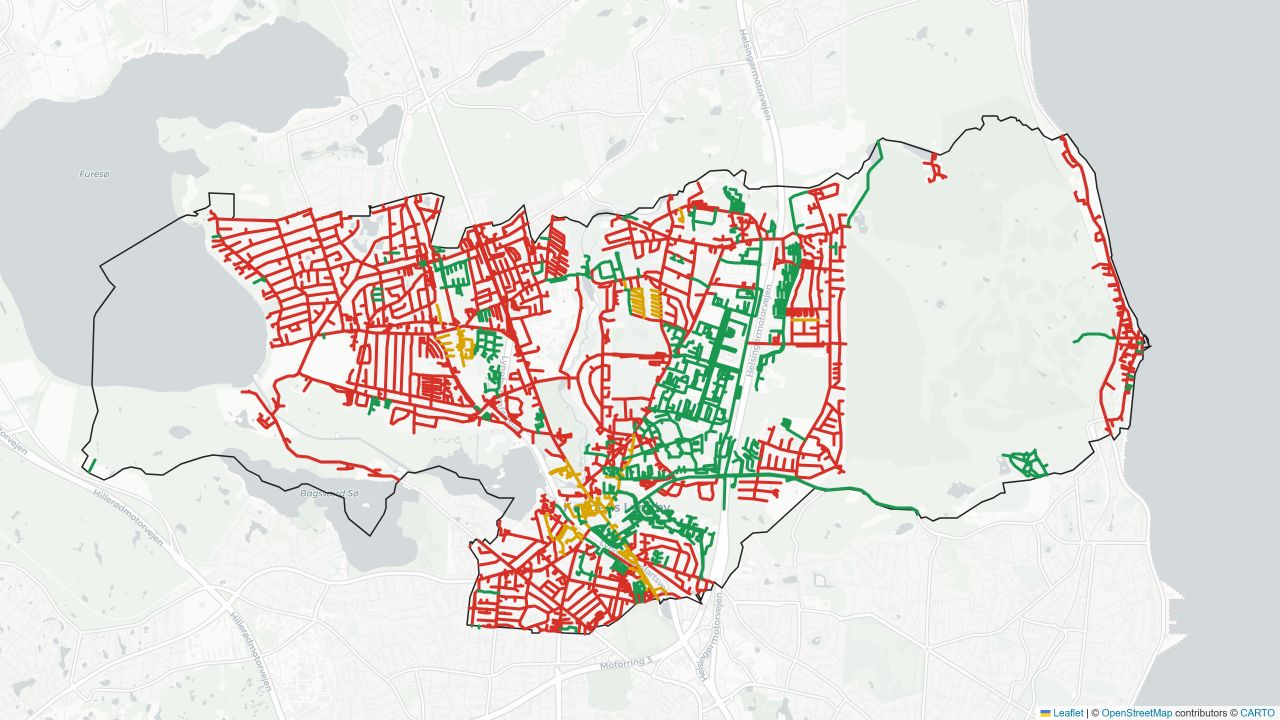
Because the temperature can only be lowered at street level, the buildings with the lowest potential determine the overall assessment of each street.
On the map, green streets contain only buildings with high or possible potential. On yellow streets, no more than 10 per cent of buildings have low potential. On red streets, the share is higher.
Surplus heat nearby
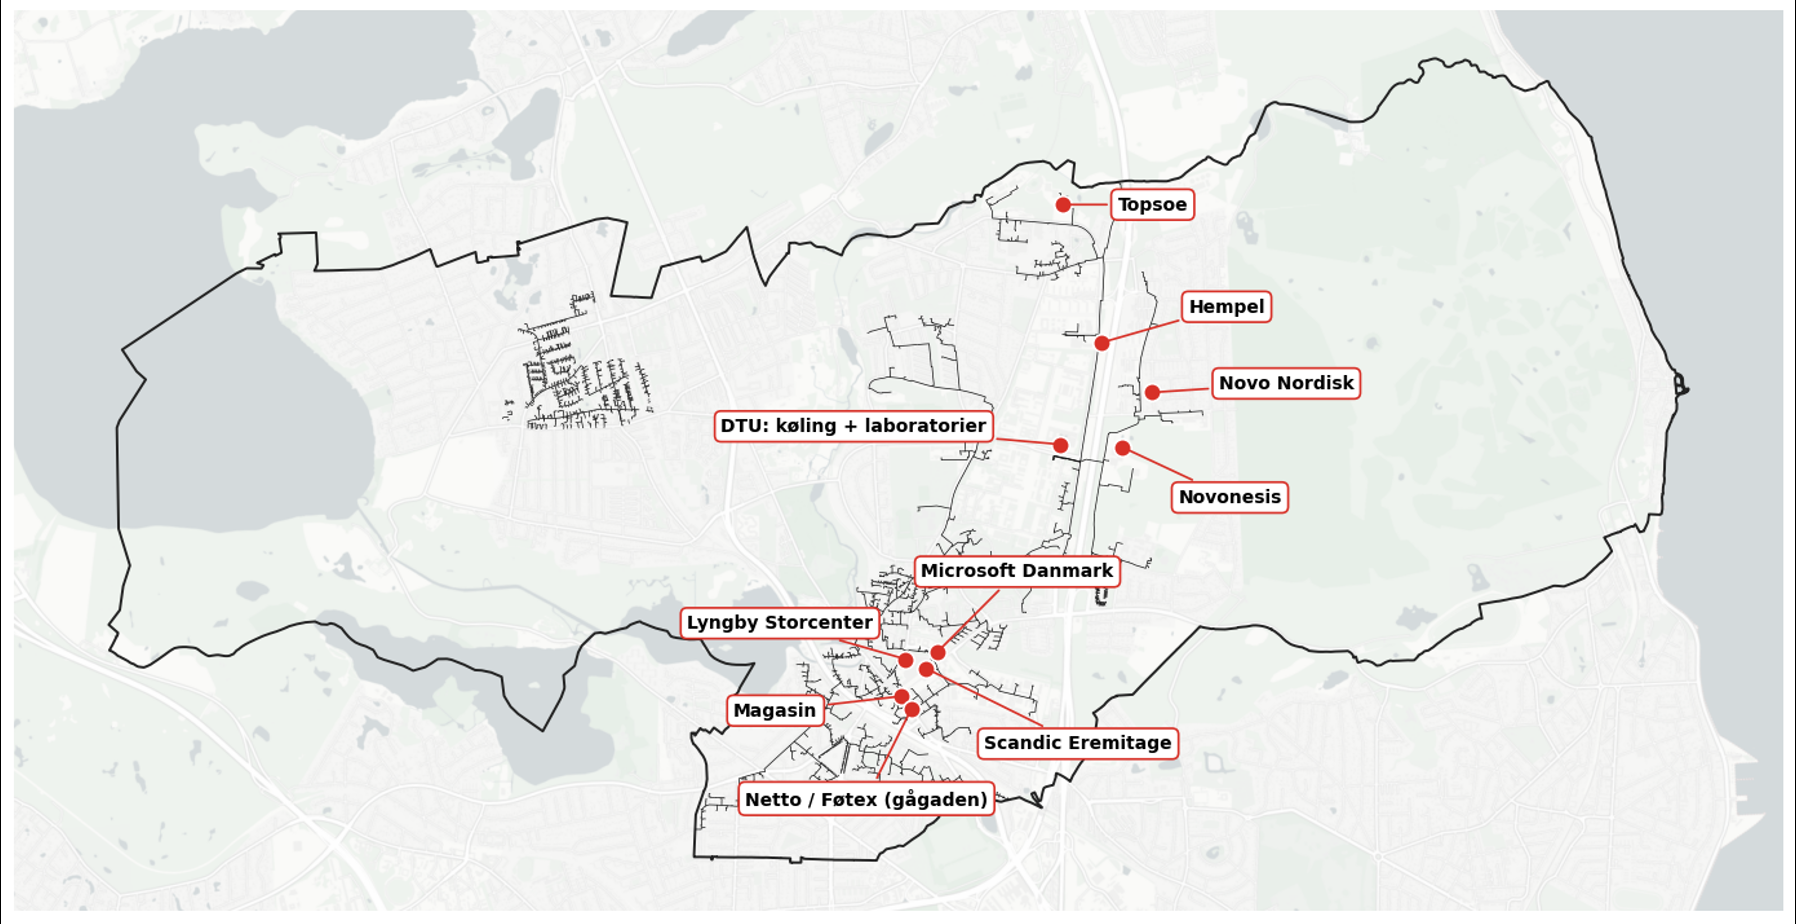
Surplus heat is heat from activities such as cooling or production that would otherwise go unused.
The analysis assesses 78 businesses using EnergyMAPS data from Varmeplan Danmark 2021. Ten sites are then selected using the municipal energy plan and an assessment of cooling systems. The results are estimates that need to be followed up with measurements and direct contact with the businesses.
How the analysis can be used
The analysis points to the buildings, street sections and businesses that are most relevant for closer investigation.